Whether you're working on a management assignment, diving into psychology, or exploring data-driven fields, understanding correlational research is a foundational skill every student needs. This powerful branch of quantitative research helps researchers identify relationships between variables — without manipulating them. If you've ever struggled with research methodology in your academics and needed assignment help, this guide breaks it all down clearly, from types to real-world applications.
What Is Correlational Research?
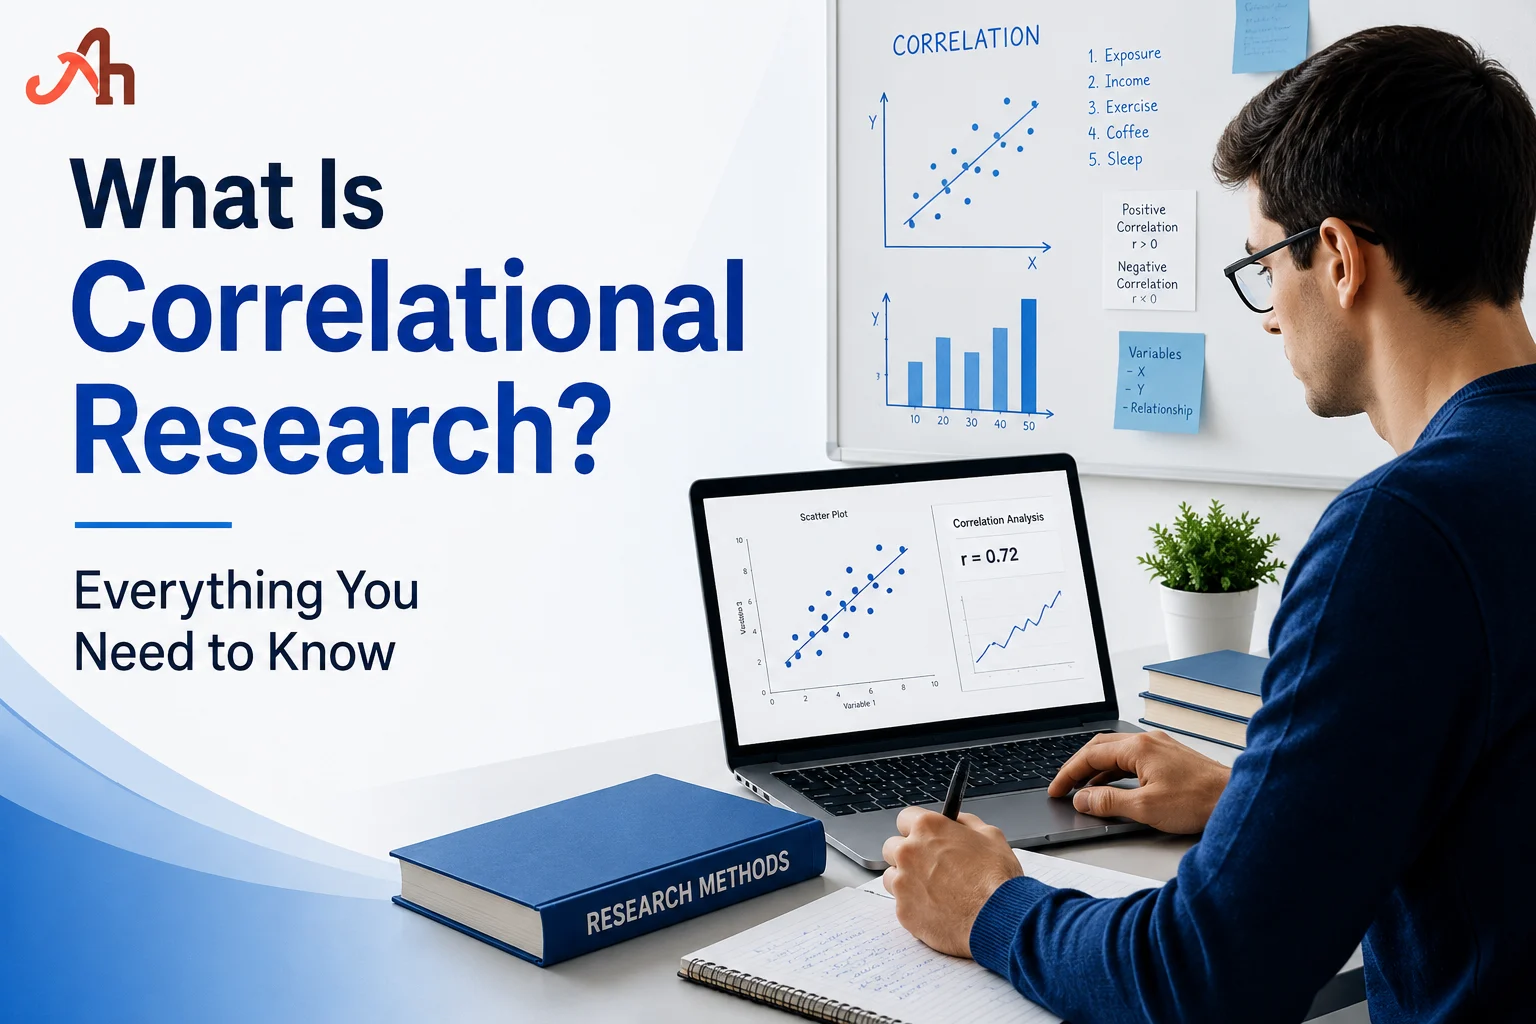
Correlational research is a type of non-experimental research method used to identify and measure the relationship (or correlation) between two or more variables. Instead of changing or controlling variables, researchers simply observe and measure them as they naturally exist.
For example:
Does screen time affect academic performance?
Is there a link between stress levels and sleep quality?
Do higher marketing budgets lead to better sales?
These are classic correlational questions — they explore relationships, not direct causes.
Key Point: Correlational research tells you that two variables are related, but it does not tell you why or prove that one causes the other.
Why Is Correlational Research Important?
In modern research methods, correlational studies play a critical role across almost every academic and professional discipline. Here's why they matter:
Cost-effective — No need for controlled environments or experiments
Ethical — Ideal when experiments would be unethical (e.g., studying effects of childhood trauma)
Predictive power — Helps forecast trends and behaviours
Foundation for further research — Correlational findings often lead to deeper experimental studies
Wide applicability — Used in psychology, healthcare, economics, education, and business
Students working on topics like healthcare management, HR management, or strategic management frequently encounter correlational data in their research — making this knowledge practically essential.
Types of Correlation in Research
Understanding the direction and strength of a relationship is central to correlation analysis. There are three primary types:
1. Positive Correlation
A positive correlation means both variables move in the same direction — when one increases, the other increases too.
Examples:
More study hours → Higher exam scores
Higher income → Greater consumer spending
Increased exercise → Improved mental health
In a graph, a positive correlation shows an upward slope.
2. Negative Correlation
A negative correlation means the variables move in opposite directions — when one increases, the other decreases.
Examples:
More stress → Lower academic performance
Higher absenteeism → Lower grades
More screen time at night → Less sleep
In a graph, a negative correlation shows a downward slope.
3. Zero Correlation
A zero correlation means there is no relationship between the two variables — changes in one have no predictable effect on the other.
Examples:
Shoe size and intelligence
Hair colour and exam results
Name length and career success
This is equally important to identify — it rules out false assumptions and keeps research accurate.
Correlation vs Causation — The Most Common Mistake
One of the most misunderstood concepts in quantitative research is the difference between correlation vs causation.
What's the Difference?
Classic Example: Ice cream sales and drowning incidents both increase in summer. They're correlated — but eating ice cream doesn't cause drowning. The hidden variable is hot weather.
This is why students writing a dissertation help project or thesis help paper must be extremely careful when interpreting correlational data. Always acknowledge confounding variables.
Methods Used in Correlational Research
Researchers use several techniques to collect and analyse data in correlational studies. These overlap with broader research methods used across disciplines.
Common Data Collection Methods
Surveys and Questionnaires — Widely used in psychology, marketing assignment research, and social sciences
Observations — Recording natural behaviour without interference
Archival Research — Analysing existing records, databases, or historical data
Secondary Data Analysis — Using pre-existing datasets (common in accounting assignment and economics research)
How Is Correlation Measured?
The most common statistical measure is the Pearson Correlation Coefficient (r), which ranges from -1 to +1:
+1 = Perfect positive correlation
0 = Zero correlation
-1 = Perfect negative correlation
Other measures include:
Spearman's Rank Correlation — For non-parametric or ordinal data
Kendall's Tau — Used with smaller sample sizes
Point-Biserial Correlation — When one variable is dichotomous (e.g., pass/fail)
Real-World Applications of Correlational Research
Correlational studies are applied across a remarkably wide range of fields. Here's how they appear in areas relevant to students:
Business and Management
In strategic management and risk management, organisations use correlational data to:
Identify patterns between employee satisfaction and productivity
Analyse links between market trends and sales performance
Predict financial risks based on historical data
Healthcare and Nursing
healthcare management and nursing assignment work, correlational research helps:
Identify lifestyle factors linked to chronic disease
Explore relationships between patient outcomes and care quality
Guide policy decisions with data-backed insights
Education and Social Sciences
For students completing coursework help, homework help, or essay writing assignments in social sciences:
Researchers study links between socioeconomic status and academic achievement
Psychologists examine correlations between anxiety and social behaviour
Educators analyse attendance patterns versus grade outcomes
Child Development
In childcare assignment research, correlational methods are used to:
Study how early childhood environments influence cognitive development
Explore parenting styles and emotional regulation in children
Measure correlations between nutrition and developmental milestones
Advantages and Disadvantages of Correlational Research
Advantages
No manipulation required — Natural and ethical
Large datasets possible — More statistical power
Real-world applicability — Reflects genuine behaviour
Quick and cost-efficient — Especially with surveys or archival data
Foundation for hypothesis building — Guides experimental research
Disadvantages
Cannot prove causation — The biggest limitation
Confounding variables — Third factors can distort results
Self-report bias — Survey data can be unreliable
Directionality problem — It's not always clear which variable influences which
Overgeneralisation risk — Findings may not apply universally
Tips for Students Writing About Correlational Research
Whether you're completing a case study, seeking dissertation help, or writing a full thesis help document, here are essential tips:
Do's
Clearly define your variables before beginning
Use appropriate statistical tests (Pearson, Spearman, etc.)
Report the correlation coefficient and its significance level (p-value)
Acknowledge limitations and confounding variables honestly
Don'ts
Never claim causation from correlational data alone
Avoid cherry-picking data to support a conclusion
Don't ignore outliers — they can significantly affect your results
Never skip a literature review — previous studies add credibility
Conclusion
Correlational research is a powerful and widely used tool across academic disciplines — from english assignment writing to complex marketing assignment analysis. It enables researchers to uncover meaningful patterns, guide decision-making, and lay the groundwork for experimental studies. By understanding the three types of correlation, mastering correlation analysis, and always remembering the golden rule of correlation vs causation, students can conduct more credible and impactful research. Whether you're tackling a simple homework help task or a full dissertation help project, applying correlational methods correctly will always strengthen your academic work.